Working with Report Tables
This section provides instructions for the following:
Customizing Report Tables
This section provides instructions for customizing the structure and appearance of report tables in Reporting.
Filtering Tables
A Filters panel with an expand button  appears on the left side of the Dashboard and certain report pages in Reporting. The filter options available depend on which report you are viewing.
To apply filters to any report with the filter panel:
1.Click the Filters panel expand button or the button representing the facet you want to filter by. The Filters panel expands.
2.Select the option(s) you want. You may need to expand higher-level options to find lower-level ones.
3.Click Apply. The report updates to reflect the data in the selected filters. The row of filter details below the table header shows whatever filters are applied.
4.Optional: To remove the applied filters, open the Filters panel again and click Clear Filters. Click Apply.
Once you've filtered a report, all the reports that can be accessed from the page you're on will be filtered the same way. Filters do not persist when you log out, change user roles, or switch between systems.
Table 11 provides an overview of the filters available in Reporting.
| Filter | Options | Available Reports |
|---|---|---|
 |
Test groups organize assessments by type, subject, and grade level. You can select any number of options from the hierarchy of checkboxes.
Note that teachers can also set preferences for which specific tests to view, and this setting persists across sessions, as well as being potentially useful to other users. |
|
 |
Test reasons are categories used for organizing test opportunities. When your test opportunities have test reasons, you can filter reports by a single test reason. For example, if there are test reasons for If you don't filter by test reason, the reports default to showing data for all test reasons. This will allow you to compare multiple test reasons side by side, but the data will not be disaggregated. You may find disaggregated data easier to understand.
|
|
School Year  |
In the Student Portfolio Reports, you can view all of the results within a school year or across years to see how students perform over time. If you don’t filter by school year, the Student Portfolio Report will default to showing data only for the current year. You may find a single year's data easier to understand, or you may find it useful to view data spanning multiple years.
|
Sorting Tables
Some tables allow you to sort the data by various columns. Sortable columns display a set of arrows  in the column header.
To sort a table:
1.To sort by descending order, click the header of the column you wish to sort by. The bottom arrow in the header is shaded darker  when the column is sorted in descending order.
2.To sort by ascending order, click the column header again. The top arrow in the header is shaded darker  when the column is sorted in ascending order.
Customizing Table Rows
You can specify the number of rows each table displays at a time. Your specifications persist for that table.
To specify the number of rows displayed, do one of the following:
- In the Rows per page field
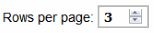 below the table, enter the number of rows you want the table to display per page.
 - Click the arrow buttons on the right side of this field to increase or decrease the number of rows displayed in increments of one.
Viewing Additional Rows and Columns
If a table has more rows than can be displayed on a single page, the table data will be paginated. The number in the lower-right corner of a table indicates how many rows are in the table.
To view additional table rows:
- To move to the next and previous pages in a table, click the arrow buttons

 at the lower-right corner of the table.
 - To jump to a specific table page, enter the page number in the field
 at the lower-right corner of the table.
If a table has more columns than can be displayed on a single page, a set of arrow buttons appears on the table margins.
To view additional table columns:
To scroll the table to the right and left, click the arrow buttons 
 on the right and left sides of the table. Alternatively, click and drag the green horizontal scrollbar at the bottom of the table.
If a table contains expandable sections, click the section bars or ![]() and
and ![]() to expand and collapse them.
to expand and collapse them.
If you're navigating the page by tabbing through it, you may want to expand all the expandable sections of a table at once. This feature, which is available in most Assessment Reports, will make the table accessible to a screen reader.
To expand all accordion sections in a table:
1.Navigate to the table by tabbing through the page in your browser. When the "Load Accessible Table" message appears, press the Enter key. All expandable sections in the table expand.
2.Optional: To collapse all sections again, navigate back to the table. When the "Hide Accessible Table" message appears, press the Enter key. All expandable sections in the table collapse, except the Total column.